;)
;)
;)
tagged  metrics, philosophy, risk, vulnerability in metrics, philosophy, risk
metrics, philosophy, risk For the impatient, here is a summary. For the rest, read on to see from whence the conclusions derive. :)
For the example addressed here, the Common Vulnerability Scoring System (CVSS), there is no structural difference between its construction as a Vulnerability Metric and a generalized Risk Metric model. The types of information that go into both are the same and the behavior of CVSS is consistent with the model. We might draw the conclusion, then, that the difference between Vulnerability and Risk is only semantic. However, we may also argue that the differences between the terms Vulnerability and Risk may at least in part stem from how the output function of the metric behaves and the information the output value carries. Moreover, interpretation of the metric output can depend on the perspective of the individual but still provide useful, actionable information.
This is an Interesting Question™ that can motivate long discussions but I think we have a starting point to work through it. Last week I spent time describing a framework for discussing the concept of Risk. That framework serves as a model for Risk Metrics in general and comprises several components: Actor, Action, Exploit, Bad Thing™ and Risk. Let me emphasize here: the diagram is a model for Risk Metrics in general (although I do not claim in any way that it represents all possible metrics). I include here the diagram from the previous post as a reference.
;)
Figure 1
I will point out here, and remind you again later in this article, that the circle with the word Risk in it is our model component for the (numerical, categorical, etc.) estimated value of the Risk Metric. If you want to think of that component in computational terms as producing our metric, then let's rearrange our diagram so that all inputs are into the center and reorganize the shapes in a manner consistent with the representation of a process. :)
;)
Figure 2
Let's work through our Interesting Question™ by starting with a Vulnerability Metric that many in the Computer Security field will have heard of: the Common Vulnerability Scoring System, or CVSS. You can read more about CVSS and its history by surfing to the Forum for Incident Response and Security Teams (FIRST). I urge you to bring up the CVSS 2.0 guide web page, or download the PDF from that page, if you want more details.
NOTE: The CVSS metric is used by governmental agencies and is required by those entities when products produce reports (supply data in any form) from vulnerability assessments. You may not understand or agree with the structure of the CVSS metric (I hope to address the deconstruction of CVSS in a subsequent post) but the wide requirement for its use within the United States government and hence mandated use by vendors of Computer Security products makes it our logical starting point for today.
Let's take the CVSS components and map them onto or generalized Risk Metric model. If the correspondence is good then we have an argument in favor of the assertion: "CVSS, a Vulnerability Metric, looks like (walks and talks like) a Risk Metric". If the correspondence is bad, then we will perhaps gain some understanding of how CVSS, a specific Vulnerability Metric, differs from our Risk Metric model.
I'll provide a brief overview here of the components that go into the CVSS input hopper but I will not go into the computation itself in any real detail because describing how CVSS works and reverse engineering why may require several posts.
To get started I will shamelessly reuse the diagrams from the FIRST website and call it Fair Use :) In case you are not familiar with CVSS, here are some observations about it.
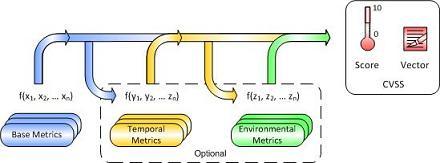
Figure 3
The figure is a bit fuzzy (low resolution) but it gets the point across. Nevertheless the figure has great value in illustrating what the CVSS does, and, more importantly, the components that go into the input hopper. It is the latter that we care about today. :)
Note: the figure as shown is not computationally precise. It implies that the mathematical operations are composed (sequenced). However, the first computational step where the inputs are the Base Metrics includes a nonlinearity (a step function). The Environmental Metrics (the green arrow and function) are applied, in part, by sticking their little fingers into the blue machinery before the nonlinearity.
Recall that I said early on in this article that the central Risk component in the general model of Risk Metrics can be thought of as a placeholder for a computation. This is our starting point for mapping the CVSS computation diagram to our generalized risk model diagram. The blue arrows and the representations of mathematical operations that look like f(x1, x2, …, xn) map onto the Risk Model central component called Risk.
The next question, then, is whether, and how, the components represented by the categories called Base Metrics, Temporal Metrics, and Environmental Metrics, map onto our other Risk Model components of Actor, Action, Exploit, and Bad Thing™.
What is inside those categories? Once again I'll invoke Fair Use again and reuse the diagram from the original CVSS documentation.
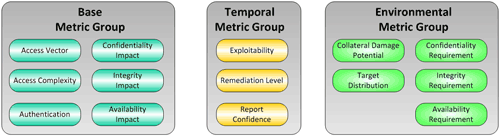
Figure 4
We'll go through all these items and map then into our Risk Metric model. Along the way I'll briefly describe the categories. Let's start with the Base Metric Group bits.
Access Vector - This component is intended to classify (quantify) where the attacker (the Actor) an be located to invoke the exploit: Local (at the physical system), Adjacent Network (meaning, on the local subnet, or essentially in the building), or Network (remotely exploitable).
Nice. The Access Vector corresponds to a property of the Actor in our general model of Risk Metrics.
Access Complexity - This component is intended to classify (quantify) how complex (how difficult) it is to exercise the Exploit once the attacker (the Actor) has access.
So, Access Complexity is a property of the Exploit component in our general model of Risk Metrics.
Authentication - This component is intended to classify (quantify) the number of times an attacker must authenticate to a target in order to exercise the Exploit.
Ok! The Authentication component maps onto the Action component of our general model of Risk Metrics.
The last three items in the Base Metric Group are easy!
Confidentiality Impact, Integrity Impact, and Availability Impact - These all classify (quantify) what happens to confidentiality, integrity, and availability of something in the customer environment if the Exploit gets exercised.
Clearly those land inside our Bad Thing™ component. :) Let's add the items above to our diagram and see what it looks like.
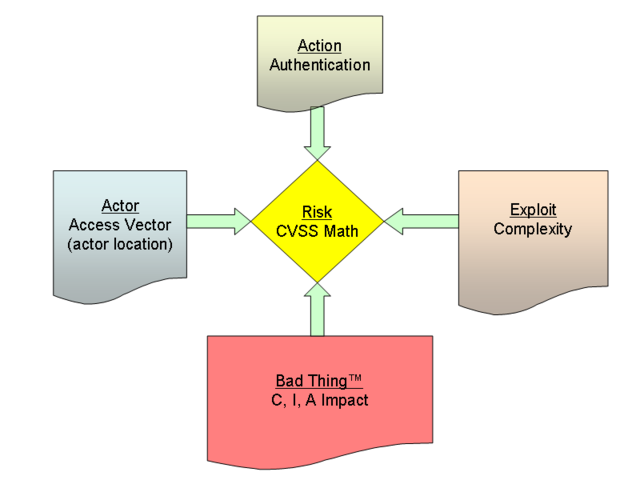
Figure 5
Let's work through the components of the Temporal Metrics Group.
Exploitability - This component classifies (quantifies) the current state of techniques and code availability for the exploit.
Expoitability is a bit tougher. At first glance it would seem to be a property of the Exploit component in our general model of Risk Metrics. However, one could argue that Exploitability belongs in the Action bin, especially for the script kiddy crowd. There is nothing to say we can't place it in both bins, so lets do that.
Remediation Level - This component classifies (quantifies) the available defensive measures available for this exploit.
Again, Remediation Level is a property of the Exploit component in our general model of Risk Metrics.
Report Confidence - This component is intended to classify (quantify) the level of credibility of a reported exploit. [ Ed. presumably to account for lies designed to generate Fear, Uncertainty, and Doubt?]
Report Confidence is clearly a property of the Exploit component in our general model of Risk Metrics.
Collateral Damage Potential - This component is intended to classify (quantify) the potential for really bad stuff to happen, like loss of life or physical damage to infrastructure. [Ed. This reminds of the scratch monkey (http://en.wikipedia.org/wiki/Scratch_monkey) story. ]
Clearly Collateral Damage Potential one falls into the Bad Thing™ category -- it is a refinement of how bad "bad" might get.
Target Distribution - This component intends to classify (quantify) the proportion of vulnerable systems in the customer environment that have the Exploit. [ Ed. Note that, as I'll discuss in a later article, it is perhaps counterintuitive that if the number of vulnerable systems is zero the CVSS does not go to zero.]
Only one more to go!
Security Requirements (CR, IR, AR) - These three (although they are listed as one thing) are intended to classify (quantify) how important the previously called-out components of Confidentiality Impact, Integrity Impact, and Availability Impact actually are within a customer environment. [Ed. This is the bit that goes back into the computation before the nonlinearity in the CVSS math, which I mentioned earlier.]
Ok, again, these fall into how bad the Bad Thing™ actually is. :) We're almost done! So, what does our diagram look like now?
;)
Figure 6
Let's enumerate what we see from the comparison.
Let's go back to our original description of the CVSS score above and recast the language in terms of our generalized Risk Metric model.
The CVSS Base Score is, from a structural perspective, most like a Risk Metric in that all inputs can arguably be assigned to one of each of the four Risk Metric input types (see Figure 5).
The Temporal Metrics inject data into the model primarily about the Exploit but possibly about the actions required to exercise the exploit.
Perhaps most interestingly, the Environmental Metrics Group injects data into the model specifically as a way of customizing the metric to the environment of the observer! Stated directly, the behavior of CVSS when the Environmental Metrics data is injected may not be consistent with an external observer's expectations. Why? Because the external observer will almost assuredly not be given the proprietary data that is the Environmental Metrics.
At this point I feel safe in making the assertion:
"CVSS, a Vulnerability Metric, looks like (walks and talks like) a Risk Metric"
I think that is enough for today. I thank those of you who have been patient or diligent enough to get this far and welcome your observations. In the mean time, we still have more questions for the future! I'll leave you with those here:
Does CVSS behave the way we would expect when the input values change?
Can we create useful Metrics without quantifying dollar cost?
The Common Vulnerability Scoring System page of the Forum of Incident Response and Security Teams
can be found here.
The documentation for version 2.0 of the Common Vulnerability Scoring System
can be found here.
A handy online calculator for CVSS that allows you to explore its behavior can be found here.
metrics, philosophy, risk
Reader Comments