ThreadMonitor
Current version: 1.2
Summary
Have you ever written a multithreaded program that runs fine for a while, but then at odd and unpredictable times crashes, locks up, uses up all you CPU or memory, or otherwise misbehaves? Threadmonitor uses Microsoft's Performance Data Helper API to look deep into your program to enumerate processes, threads, and resource usage. More importantly, if you add a bit of code to your program, each thread in your multithreaded application can communicate with you!
What Can ThreadMonitor Do?
- Provide application and thread specific debugging information
- Provide application and thread specific resource-usage information
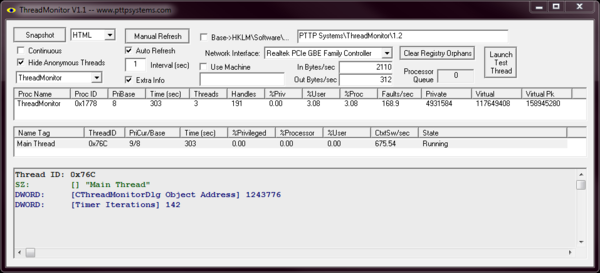
- Automatically or manually capture debugging information in TEXT, CSV, XML, or HTML format
- Hide anonymous (untagged) thread information
- Collect information about selected network interface
Files: ZIP archive file containing both the 32-bit and 64-bit versions with MD5 hash and PGP signature. It also contains a C++ header file with example code for tagging your threads.
Screeen Shots
Main Interface
How Does ThreadMonitor Work?
ThreadMonitor enumerates the thread id's (not handles) for all threads associated with the selected application, then searches through the Windows registry for information "tagged" to that thread. Each thread can provide information via the registry so that you can figure out which is the culprit preventing you from releasing your application. :) By default, ThreadMonitor looks in a special location in the registry to look for information "tagged" to the thread of interest. The base location for "thread tagging" information is
Where [Threadmonitor version] is the current version number of this application. ThreadMonitor searches the registry below the base location using the targeted application's name.
ThreadMonitor looks at itself by default. If the main thread ID is 1316 (0x524) then ThreadMonitor will search for thread tagging information in a specific registry location. On a 32 bit system, and on a 64-bit system with the 64-bit executable, the default locations is
On a 64-bit system using the 32-bit version of thread monitor the deafulat location is
- HKEY_LOCAL_MACHINE\Software\Wow6432Node\PTTP Systems\ThreadMonitor\[VERSION]\ThreadMonitor\Threads\0x524
If the target application is "JoesNewApp" then ThreadMonitor will peer at the registry location
The application programmer will enter data at these locations for "tagging" threads of interest. :)
How Do I Instrument My Program?
First, start by creating code like the C++ classes that I used to instrument the ThreadMonitor program. :) This particular example depends on using an MFC base class, but MFC is not necessary, just convenient. Instrumenting your program with this example is simple.
CRegisterProcess g_oRegisterProcess(_T("ThreadMonitor"));
 CRegisterThread oThreadTagger;
 oThreadTagger.Register(g_oRegisterProcess, _T("Main Thread") );
These classes are designed so that they can automatically delete the registry keys when the thread and/or process terminates. Be kind to your registry. :)
One More Thing
You can use the "Base->HKLM\Software..." feature to place your registry information in protected or otherwise differently configured registry locations. Type in the base registry path under which your thread tagging data will be placed. When enabled, ThreadMonitor looks in
for data "tagging" threads of interest. :)
Also, the "Snapshot" button drops files into c:\capture<timestamp>.<ext>. If I can find the time I might make that a bit more configurable.


